Dashboard interface that enables business intelligence
Dashboards Built With A Purpose
Having operational data available in an easy format streamlines processes and promotes transparency. STP’s interactive dashboards give you at-a-glance information that improves oversight and operation control.
Better oversight and transparency with:
- Reconciliation Dashboard: Detailed reconciliation view of account summary, transactions, and position break information
- Performance Dashboard: Detailed performance measurement research tool for portfolio, composite, and benchmark data
- Account Notification Dashboard: Insight into new and closed portfolios
- Investor Portal: Investment portal exposing account level information in a customizable dashboard and document vault view
- Advisor View: Planning and performance experience for advisors
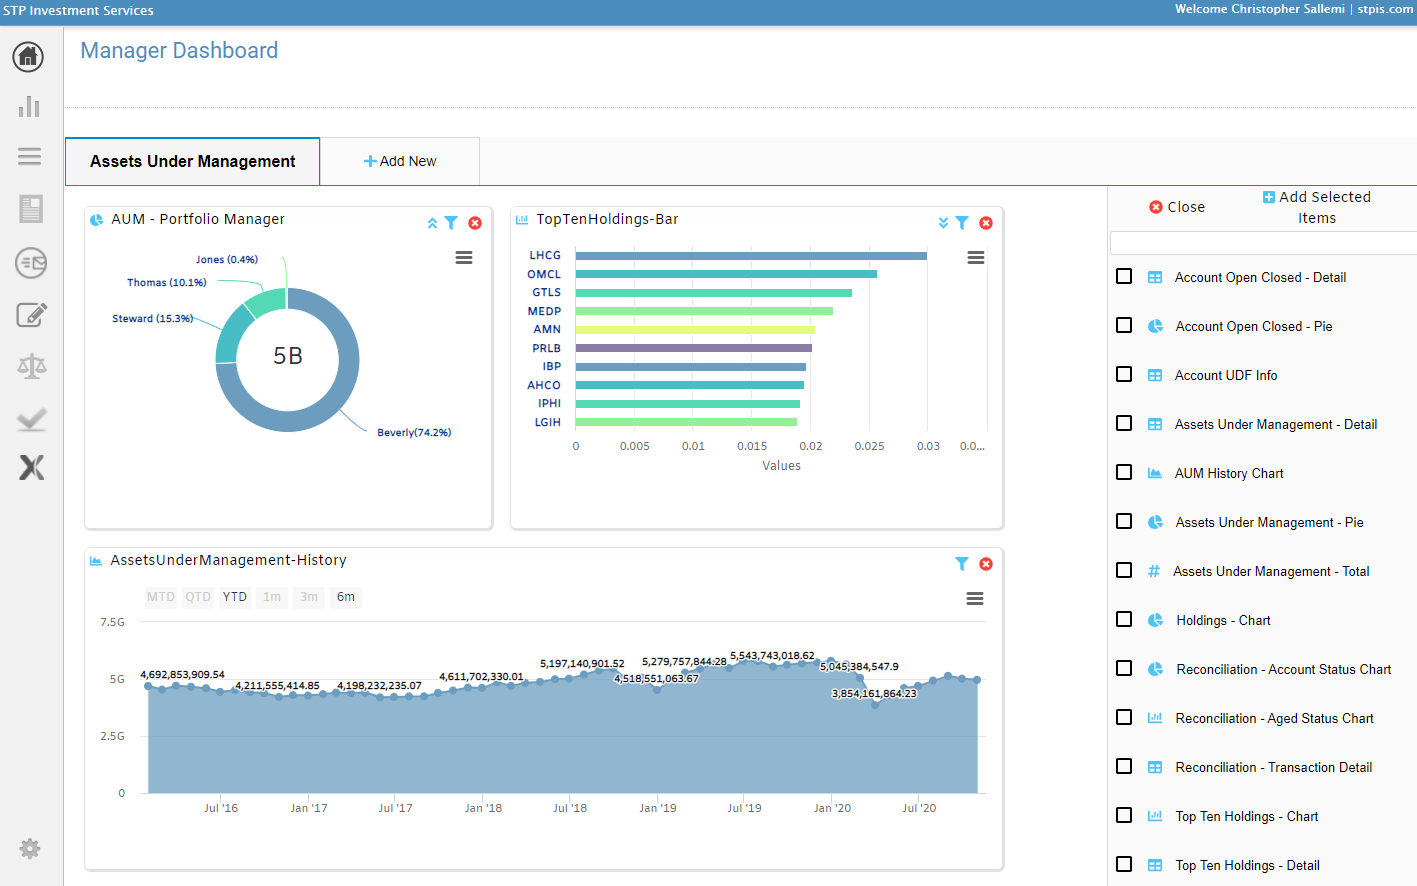
Interactive Dashboards
STP’s dashboarding engine also empowers end users to create custom views on the fly. All widgets are interactive, configurable and provide real-time drill down capabilities. A sample of the available widgets that can be customized and consumed include:
- Assets Under Management – summary view, chart view filtered by portfolio manager, strategy and asset class, detailed market value portfolio breakout
- Holdings – Asset allocation, top ten, bottom ten, and much more
- Reconciliation – Account status, aged status, transaction, and position detail
- Report Builder – Integration with our powerful reporting engine
- Account Notification – Summary and detailed views of portfolio opening and closing metrics
- User Defined Fields (UDFs) – Tabular view of the UDF universe
- Over 100 data widgets to choose from!
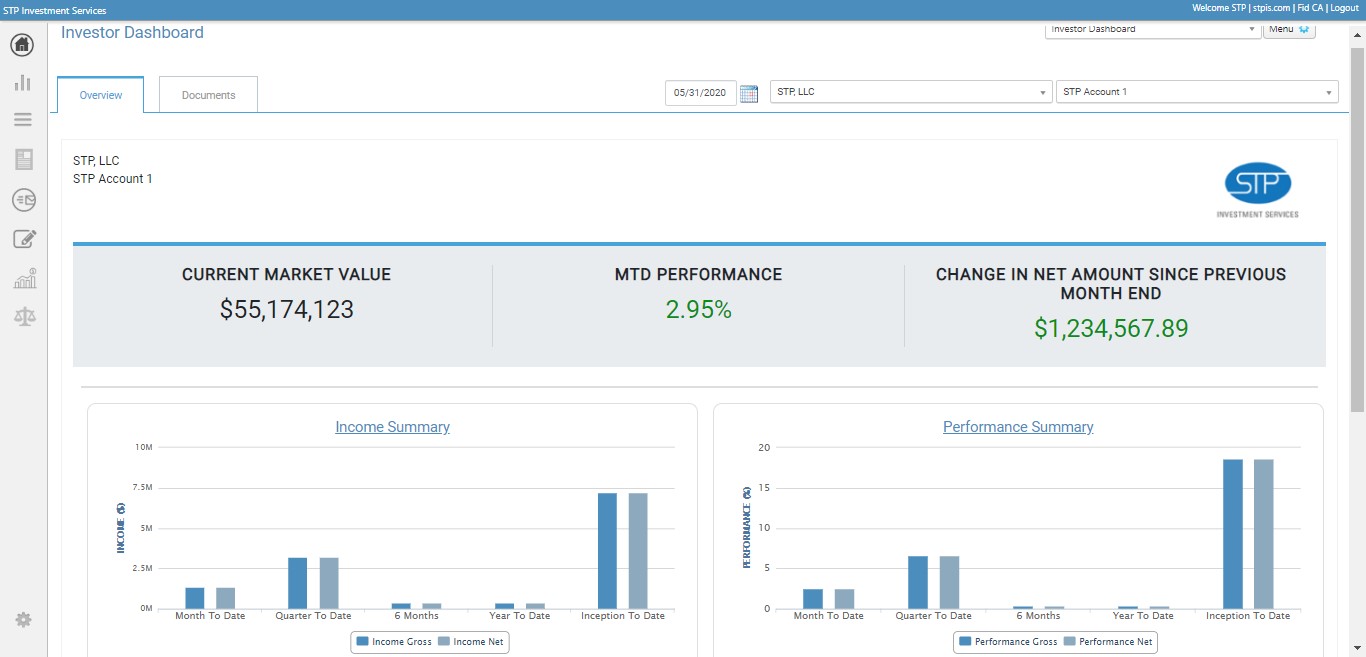
Improve The Client Experience With Investor Dashboards
STP’s powerful Investor Portal enables your investors, limited partners, advisors, and others to login and view metrics including:
- Current market value
- Month-to-date performance
- Monthly change in net performance
- Graphs with summary view of income and performance (both net and gross)
- MTD, QTD, 6 Month, 1 Year, 3 Year, YTD, ITD
- Interactive asset allocation view
- Document view for secure statement and report access